

Let IAM users self-manage MFA in an AWS account (without giving away the keys)
Give IAM users the ability to enroll and manage their own MFA devices in AWS—without opening up risky permissions. This guide walks through a least-privilege IAM group setup using two customer-managed policies: one to enable self-service MFA actions and one to enforce MFA for all other access, plus a simple CLI workflow and break-glass best practices.

User Journey Diagrams with Mermaid
Mermaid user journey diagrams turn fuzzy “user clicks around” stories into clear stages, tasks, and friction points. Learn the journey syntax, scoring (0–5), multiple actors (support/billing), and how to pair journeys with flowcharts or sequence diagrams to make improvements actionable.
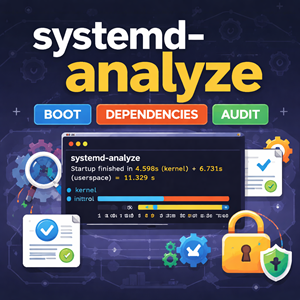
systemd-analyze: Measure Boot Time, Trace Dependencies, and Audit Unit Files
systemd-analyze turns “this box boots slow” into hard data. Learn how to measure boot time, identify the true critical-path blockers, generate an easy-to-share SVG boot timeline, lint unit files before deploying changes, and audit service hardening so you can make boots faster and services safer.

ER Diagrams for What’s in the Database with Mermaid
Mermaid ER diagrams are a simple way to answer “what’s in the database?” without drowning in DDL. Learn cardinality, optional relationships, join tables, reference data, and real-world patterns that keep diagrams readable and accurate.

Install WordPress with WP-CLI (with Interactive Prompts)
Install WordPress from the command line using WP-CLI: download core, generate wp-config.php, and run the install in minutes. Then eliminate flag-fatigue with WP-CLI’s interactive –prompt mode and a simple wp-cli.yml so repeat installs feel like a guided wizard.
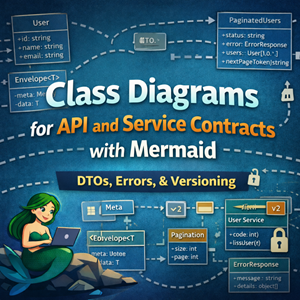
Class Diagrams for API and Service Contracts with Mermaid
Mermaid class diagrams are a great way to document API and service contracts: request/response DTOs, reusable envelopes, pagination, errors, and service interfaces. This guide shows practical patterns and examples you can keep in git alongside your code.

WordPress “The link you followed has expired” — Fixing Upload POST Size Limits (Apache proxy_fcgi + PHP-FPM)
WordPress’s “The link you followed has expired” is often a misleading symptom of a server-side upload rejection. When PHP (or the web server) refuses a large POST body—like a theme/plugin ZIP—WordPress never receives the request and falls back to that generic message. The fix is to raise post_max_size and upload_max_filesize (plus a sensible memory_limit), restart PHP-FPM, and re-try the upload.

State Diagrams for Lifecycle Modeling with Mermaid
State diagrams answer a different question than flowcharts and sequence diagrams. Flowcharts: What steps happen? Sequence diagrams: What calls happened in what order? State diagrams: What states can this thing be in, and what events move it between states? If you’ve ever tried to explain “healthy → draining → terminated” (or “closed → open → half-open”), a state diagram is usually the cleanest way to do it. This post focuses on Mermaid state diagrams for modeling lifecycles you’ll actually run into in ops and engineering: deploys, load balancers, workers, and circuit breakers. A quick refresher: the minimum you need Mermaid’s modern syntax is stateDiagram-v2. Source
|
1 2 3 4 5 6 7 8 |
stateDiagram-v2 [*] --> Idle Idle --> Running: start Running --> Idle: stop Running --> Failed: crash Failed --> Idle: recover Idle --> [*] |
Rendered Conventions worth adopting Use nouns for states: Healthy, Draining, Degraded Use verbs/events on arrows: timeout, deploy, deregister, success Keep labels short; if you need paragraphs, add a note or link to a runbook 1) Model “system lifecycle” states (a great first use) Many
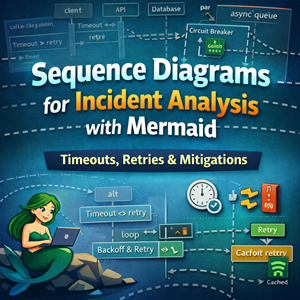
Sequence Diagrams for Incident Analysis with Mermaid
Sequence diagrams are perfect for postmortems: they show what happened in order and where time went. Learn Mermaid features for modeling timeouts, retries, fan-out, async queues, and mitigations like circuit breakers and cached fallbacks.
Min, Max, Mean, Average, P90, P95, and P99: What They Mean (and When to Use Them)
If you’ve ever looked at system metrics, API latency charts, or a performance report, you’ve probably seen a mix of terms like minimum, maximum, mean, average, and percentile values like p90, p95, and p99. They all describe “what the numbers look like,” but they answer different questions. Picking the wrong one can hide real problems—or make healthy systems look broken. This guide explains what each metric means, how to interpret it, and which one to use for common monitoring and reporting scenarios. A quick mental model Imagine you measure the response time for 10,000 requests over a minute. You now have a list of numbers (one per request). Summary statistics help you describe that list: Min/Max: the extremes Mean/Average: the center (one kind of “typical”) Percentiles (p90/p95/p99): “how bad it gets for the slowest X% of requests” Minimum (min) Definition: The smallest observed value. What it answers: “What’s the fastest
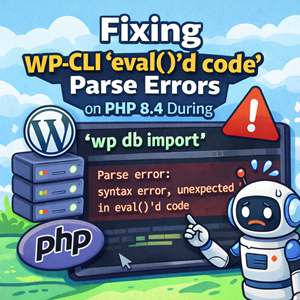
Fixing WP‑CLI “eval()’d code” Parse Errors on PHP 8.4 During “wp db import”
Seeing a WP-CLI parse error referencing Runner.php and “eval()’d code” when importing a database? It’s usually not your SQL file—it’s WP-CLI stumbling over wp-config.php (syntax, BOM/encoding, or config logic) or a WP-CLI/PHP 8.4 mismatch. Here’s the quickest path to diagnose and fix it.

Force a 404 With a CloudFront Function (Always)
Need everything behind a CloudFront distribution to return “Not Found” instantly—without touching your origin? Here’s a tiny CloudFront Function you can attach at Viewer Request to short-circuit all traffic and consistently respond with a 404 (plus no-cache headers).

HTTP Basic Auth Is Dead
HTTP Basic Auth used to be the go-to “quick gate” for staging sites and temporary protection. In 2026 it’s functionally broken: modern browser behavior is moving away from reliable prompt-based auth, and WordPress speculative loading now triggers background requests that make Basic Auth unreliable in real-world deployments.
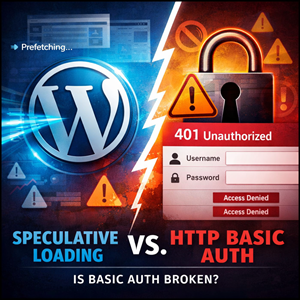
WordPress 6.8 Speculative Loading Can Break HTTP Basic Auth
WordPress 6.8’s new Speculative Loading feature can trigger background requests that break HTTP Basic Auth–protected staging sites. Disabling speculative loading may help — but real-world testing shows it’s not always sufficient, and it may be time to rethink Basic Auth as a staging gate.
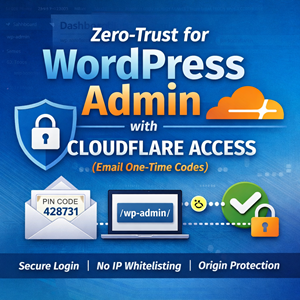
Zero‑Trust for WordPress Admin with Cloudflare Access (Email One‑Time Codes)
Stop chasing changing IP addresses and reduce WordPress admin login friction by placing Cloudflare Zero Trust (Access) in front of /wp-admin and wp-login.php using one-time email codes—without setting up Google or Microsoft SSO.

Enabling Binary Logging on Amazon Aurora Serverless (MySQL) for Fivetran
Getting a Fivetran MySQL connector error about SHOW MASTER STATUS? Here’s how to enable Aurora Serverless binary logging (the right way), set binlog retention, validate your configuration, and finish setup with a clean re-sync.

GitGraph for Release and Branch Strategy with Mermaid
Mermaid GitGraph diagrams make branching strategy easy to explain and hard to misinterpret. This guide shows trunk-based development, release branches, hotfixes, backports, and GitFlow patterns—with tags and “merge forward” rules you can copy into your engineering docs.
Fixing WP-CLI “Some code is trying to do a URL redirect” Warnings
WP-CLI warnings about unexpected redirects usually come from plugins running browser-only logic during CLI bootstrap. Here’s how to identify the culprit, run commands cleanly, and apply an update-safe MU-plugin fix.
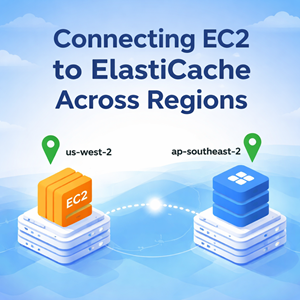
Connecting an EC2 Instance in us-west-2 to ElastiCache (Redis/Valkey) in ap-southeast-2
Need to connect an EC2 instance in us-west-2 to an ElastiCache Redis/Valkey cluster in ap-southeast-2? This guide walks through the only safe way to do it—private networking—covering inter-region VPC peering (or Transit Gateway), routing, security group rules for port 6379, DNS resolution, and a quick checklist for troubleshooting timeouts.

Gantt Charts for Infra Work with Mermaid
Mermaid Gantt charts are a simple way to plan infra work: phases, dependencies, milestones, parallel tasks, and rollback lanes. This guide shows practical patterns for maintenance windows, migrations, and staged rollouts with copy/paste examples.