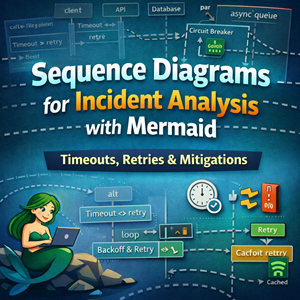
When a system misbehaves, the hardest part is usually answering: what happened, in what order, and where did time go?
That’s exactly what sequence diagrams are for.
Mermaid sequence diagrams are especially handy for incident work because they’re:
- Time-oriented (the page reads top-to-bottom like a trace)
- Reviewable (stored with postmortems and runbooks)
- Fast to update (as the incident story becomes clearer)
This guide focuses on the Mermaid features you’ll use to document timeouts, retries, fallbacks, partial failures, and mitigations.
A quick refresher: the core building blocks
A Mermaid sequence diagram starts with sequenceDiagram, then you define participants and messages.
Source
|
1 2 3 4 5 6 7 8 9 10 |
sequenceDiagram participant C as Client participant A as API participant D as Database C->>A: GET /orders/123 A->>D: SELECT order D-->>A: row A-->>C: 200 OK |
Rendered
Message arrows you’ll use most
->>request/call-->>response/return (often used for “success”)-)and--)asynchronous messages (fire-and-forget)
1) Model time and latency explicitly
Incidents often come down to where latency accumulates. Show it.
Add timing notes
Source
|
1 2 3 4 5 6 7 8 9 10 11 12 13 |
sequenceDiagram participant C as Client participant A as API participant D as Database C->>A: GET /orders/123 Note right of A: p95 spikes from 120ms to 2.3s A->>D: SELECT order Note right of D: lock wait ~2s D-->>A: row A-->>C: 200 OK |
Rendered
Autonumber requests (helps in postmortems)
Source
|
1 2 3 4 5 6 7 8 9 10 11 |
sequenceDiagram autonumber participant C as Client participant A as API participant D as DB C->>A: GET /health A->>D: SELECT 1 D-->>A: ok A-->>C: 200 |
Rendered
2) Capture failures cleanly with alt, opt, and else
The most common incident shape: success vs timeout
Source
|
1 2 3 4 5 6 7 8 9 10 11 12 13 14 15 16 |
sequenceDiagram participant C as Client participant A as API participant D as Database C->>A: GET /orders/123 A->>D: SELECT order alt DB responds within timeout D-->>A: row A-->>C: 200 OK else DB times out Note right of A: request budget exhausted A-->>C: 504 Gateway Timeout end |
Rendered
Optional steps with opt
Use opt for things that may happen but aren’t required.
Source
|
1 2 3 4 5 6 7 8 9 10 11 |
sequenceDiagram participant C as Client participant A as API participant M as Metrics C->>A: POST /checkout opt emit metric A-)M: increment checkout.started end A-->>C: 202 Accepted |
Rendered
3) Show retries, backoff, and “retry storms” with loop
Retries are a top-tier incident cause. Sequence diagrams let you show the retry policy visually.
Source
|
1 2 3 4 5 6 7 8 9 10 11 12 13 14 15 16 17 18 19 20 21 22 23 24 25 26 27 28 29 |
sequenceDiagram participant C as Client participant A as API participant P as Payments C->>A: POST /pay alt first attempt succeeds A->>P: charge(card) P-->>A: ok else needs retries (max 3), exponential backoff loop retry (max 3), exponential backoff A->>P: charge(card) alt success P-->>A: ok else transient error P-->>A: 503 Note right of A: backoff 200ms, 400ms, 800ms end end end alt charge succeeded A-->>C: 200 OK else retries exhausted A-->>C: 502 Bad Gateway end |
Rendered
If you’re diagramming a retry storm, add a note with concurrency and queue depth. That’s often the “aha.”
4) Parallelism and fan-out with par
When one upstream call gets slow, fan-out makes the whole request look slow.
Source
|
1 2 3 4 5 6 7 8 9 10 11 12 13 14 15 16 17 18 19 20 21 22 |
sequenceDiagram participant C as Client participant A as API participant I as Inventory participant R as Recommendations participant P as Pricing C->>A: GET /product/42 par gather product data A->>I: GET /stock/42 I-->>A: 12 and A->>R: GET /recs/42 R-->>A: list and A->>P: GET /price/42 P-->>A: $19.99 end A-->>C: 200 OK (page) |
Rendered
5) Highlight critical sections and circuit breakers
Incidents frequently involve a bottleneck that should have been protected.
Mark the critical path
Source
|
1 2 3 4 5 6 7 8 9 10 11 12 13 14 15 |
sequenceDiagram participant C as Client participant A as API participant D as DB C->>A: POST /orders critical write transaction A->>D: BEGIN A->>D: INSERT order A->>D: COMMIT end A-->>C: 201 Created |
Rendered
Circuit breaker open: fast-fail + fallback
Source
|
1 2 3 4 5 6 7 8 9 10 11 12 13 14 15 16 17 18 19 |
sequenceDiagram participant C as Client participant A as API participant U as Upstream participant F as Fallback C->>A: GET /profile alt breaker closed A->>U: GET /user/123 U-->>A: 200 A-->>C: 200 else breaker open Note right of A: fast-fail (no upstream call) A->>F: cached profile F-->>A: stale-ok A-->>C: 200 (stale) end |
Rendered
6) Model async flows and queues without lying to yourself
If the system is async, your diagram should show it.
Source
|
1 2 3 4 5 6 7 8 9 10 11 12 13 14 15 |
sequenceDiagram participant C as Client participant A as API participant Q as Queue participant W as Worker participant E as Email C->>A: POST /invite A-->>C: 202 Accepted A-)Q: enqueue invite job Q-->>W: deliver job W->>E: send invite email E-->>W: ok |
Rendered
7) A full incident-analysis example (ready for postmortems)
This is a common incident story: upstream latency causes timeouts, retries multiply load, the queue grows, and mitigation is to reduce fan-out + open the breaker.
Source
|
1 2 3 4 5 6 7 8 9 10 11 12 13 14 15 16 17 18 19 20 21 22 23 24 25 26 27 28 29 30 31 32 33 34 35 36 37 38 39 40 |
sequenceDiagram autonumber participant U as User participant W as Web participant A as API participant R as Recommendations participant C as Cache participant Q as Queue participant S as SRE U->>W: Load product page W->>A: GET /product/42 par page data A->>C: GET cache:product:42 C-->>A: hit and A->>R: GET /recs/42 Note right of R: latency increases (p95 80ms -> 2s) loop retry (2) R-->>A: timeout Note right of A: client retry budget shrinking end end alt retries exhausted A-->>W: 504 W-->>U: Error page A-)Q: log slow-call + enqueue alert else succeeds A-->>W: 200 W-->>U: Page end Note over S,A: Mitigation: open breaker + serve stale recs S->>A: enable breaker A->>C: GET cache:recs:42 C-->>A: stale-ok |
Rendered
8) A “sequence diagram checklist” for incident writeups
Use this as a pre-publish review:
- Does each arrow represent a real call? If it’s async, use async arrows.
- Are timeouts and retry limits shown? (max attempts, budgets, backoff)
- Is the critical path visible? (what must happen for success)
- Are alternative outcomes captured? (
altfor success/failure) - Is fan-out clear? (
parfor concurrent requests) - Are mitigations included? (breaker open, cached fallback, rate limit, feature flag)
Where to go next
If sequence diagrams are working for you, the next Mermaid feature that complements incident work is state diagrams—they’re ideal for modeling lifecycle transitions like healthy → draining → unused, queue states, or circuit breaker states.