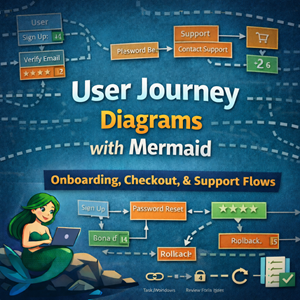
A user journey diagram is how you turn “the user clicks around” into something concrete.
It’s perfect for:
- onboarding flows
- checkout funnels
- password resets
- account recovery
- feature adoption (free → trial → paid)
- support and escalation paths
Mermaid’s journey diagram type is intentionally lightweight. That’s a feature, not a bug: it encourages you to focus on stages, tasks, and pain points instead of pixel-perfect UI.
This post shows how to use Mermaid User Journey diagrams to document flows that matter operationally—especially when you need to align product, engineering, and support.
A quick refresher
Mermaid user journeys start with journey and are built from:
- a title
- sections (stages)
- tasks with a score (0–5)
- optional “actors” per task
Source
|
1 2 3 4 5 6 7 8 9 10 11 12 13 14 |
journey title First-time login section Arrive Open landing page: 4: User section Authenticate Click "Sign in": 5: User Enter credentials: 3: User Solve MFA challenge: 2: User section Success Reach dashboard: 5: User |
Rendered
What the score means
Mermaid uses the score to represent “how good this step feels.”
A practical rubric:
- 5: effortless / delightful
- 4: fine
- 3: mild friction
- 2: annoying
- 1: painful
- 0: broken
Tip: If you don’t have data, start with your best estimate and update later.
1) Start with a story: onboarding (free → first value)
Here’s a common SaaS onboarding path.
Source
|
1 2 3 4 5 6 7 8 9 10 11 12 13 14 15 16 17 |
journey title Onboarding to first value section Signup Choose plan: 4: User Create account: 3: User Verify email: 2: User section Setup Create first project: 4: User Connect integration: 2: User Import sample data: 4: User section First value See first dashboard: 5: User Share with teammate: 4: User |
Rendered
This kind of diagram is great for identifying where to invest:
- email verification friction
- integration setup
- the step where users “get it”
2) Add multiple actors (support, billing, platform)
Most “user journeys” involve more than the user.
Source
|
1 2 3 4 5 6 7 8 9 10 11 12 13 14 15 16 |
journey title Password reset (with support) section Attempt self-service Click "Forgot password": 4: User Receive reset email: 2: User Set new password: 3: User section Escalation Contact support: 1: User, Support Verify identity: 2: User, Support section Resolution Account restored: 5: User, Support Post-incident review: 3: Support |
Rendered
This is also an ops tool: it highlights where failures become tickets.
3) Use journeys as a “funnel narrative” (not analytics)
A journey diagram won’t replace a funnel dashboard—but it’s perfect for documenting why the funnel behaves the way it does.
Checkout journey
Source
|
1 2 3 4 5 6 7 8 9 10 11 12 13 14 15 |
journey title Checkout funnel (high-level) section Cart Review cart: 4: User Estimate shipping: 3: User section Payment Enter payment details: 2: User 3-D Secure / bank auth: 1: User section Completion Order confirmation: 5: User Receive receipt email: 4: User |
Rendered
4) Combine journeys with other Mermaid diagrams
User journeys are great at telling the story, but sometimes you need a second diagram type for detail.
A useful pairing:
- Journey diagram: stages and friction
- Flowchart: decision logic (e.g., auth state machine)
- Sequence diagram: who calls what (e.g., payment + retries)
Example pairing: “Login journey” + “auth flowchart”
You can embed a small flowchart below the journey in the same post.
Source
|
1 2 3 4 5 6 7 8 9 |
flowchart TD A[User submits login] --> B{Credentials valid?} B -->|no| C[Show error] B -->|yes| D{MFA enabled?} D -->|no| E[Create session] D -->|yes| F[Challenge MFA] F -->|pass| E F -->|fail| C |
Rendered
5) Make it actionable: add “next steps” per pain point
A user journey diagram is most valuable when it becomes a backlog seed.
A simple pattern:
- score ≤ 2 → add a bullet list: hypothesis, fix, success metric
Example: “Receive reset email” is a 2
Possible next steps:
- Hypothesis: email deliverability issues (SPF/DKIM/DMARC), slow mail provider, or spam filtering
- Fix: improve sender reputation, add in-app reset link fallback, tighten messaging
- Metric: p95 reset completion time, % users requesting multiple emails
6) Common gotchas (and fixes)
Gotcha: the diagram becomes too “hand-wavy”
Fix: choose one concrete scenario:
- first-time user on mobile
- enterprise user with SSO
- user who forgot password + email changed
Gotcha: scores become political
Fix: treat scores as hypotheses until you validate with data (support tickets, analytics, session replays).
Gotcha: confusing responsibilities
Fix: always list actors and add a short legend.
7) A blog-ready checklist
Before you publish:
- Keep it to 3–6 sections.
- 5–12 tasks total (split if it’s bigger).
- Use consistent actor names:
User,Support,Billing,Platform. - Mark the 1–2 lowest-scoring tasks and include a “next steps” list.
- Pair with a flowchart or sequence diagram if the logic is complex.
Where to go next
If you like user journeys, the next Mermaid diagram type that complements product + ops work is mindmaps for runbooks and incident playbooks—great for turning a messy troubleshooting process into a navigable tree.