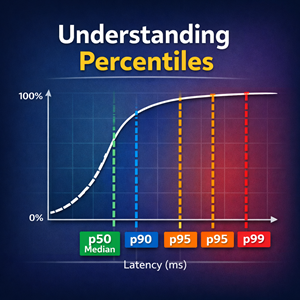
If you’ve ever looked at system metrics, API latency charts, or a performance report, you’ve probably seen a mix of terms like minimum, maximum, mean, average, and percentile values like p90, p95, and p99.
They all describe “what the numbers look like,” but they answer different questions. Picking the wrong one can hide real problems—or make healthy systems look broken.
This guide explains what each metric means, how to interpret it, and which one to use for common monitoring and reporting scenarios.
A quick mental model
Imagine you measure the response time for 10,000 requests over a minute.
You now have a list of numbers (one per request). Summary statistics help you describe that list:
- Min/Max: the extremes
- Mean/Average: the center (one kind of “typical”)
- Percentiles (p90/p95/p99): “how bad it gets for the slowest X% of requests”

Minimum (min)
Definition: The smallest observed value.
What it answers:
- “What’s the fastest we saw?”
How it’s useful:
- Verifies a system can be fast (e.g., cache hits, warm connections).
- Helps detect measurement errors (e.g., 0ms latencies from a broken timer).
Common trap:
- Min rarely reflects user experience. A single fast request doesn’t mean the system is fast.
Maximum (max)
Definition: The largest observed value.
What it answers:
- “What’s the worst-case we saw?”
How it’s useful:
- Finding extreme outliers (GC pauses, cold starts, retries, network stalls).
- Incident investigations: “Was there ever a 30s timeout?”
Common traps:
- Max is very sensitive to one weird event.
- If your sample window is big, max is almost guaranteed to look scary.
Rule of thumb:
- Use max for debugging, not for dashboards or SLOs.
Mean (a.k.a. average)
Definition: The arithmetic mean: add all values, divide by the count.
[
\text{mean} = \frac{\sum_{i=1}^{n} x_i}{n}
]
What it answers:
- “If all the total time were spread evenly, what would each request be?”
How it’s useful:
- Capacity planning and cost estimation.
- Comparing “overall load” across periods.
Common trap (big one):
- The mean can be misleading when data is skewed (which is extremely common for latency).
Example: 99 requests take 100ms, 1 request takes 10,000ms.
- Mean ≈ 199ms (looks fine)
- But that one user had a terrible experience.
Average vs mean
In everyday speech, average usually means the mean.
But in the real world (and in monitoring tools), “average” can be ambiguous and may refer to:
- Mean (most common)
- Median (p50): the middle value
- A rolling average over time (a smoothing technique)
Best practice:
- When you write or report metrics, prefer “mean” or “p50/median” instead of “average,” unless you define exactly what you mean.
Percentiles: p90, p95, p99
Definition: The value below which a given percentage of observations falls.
- p90: 90% of requests are at or below this value; the slowest 10% are above it.
- p95: 95% are at or below; slowest 5% are above.
- p99: 99% are at or below; slowest 1% are above.
What percentiles answer:
- “How slow is it for users in the worst X%?”
Why percentiles matter for latency:
Latency distributions are often “long-tailed.” Most requests are fast, and a minority are much slower. Percentiles describe that tail far better than the mean.
A simple example (sorted list)
Suppose we have 20 request latencies (ms), already sorted:
[90, 92, 93, 94, 95, 96, 97, 98, 99, 100, 101, 102, 103, 104, 110, 120, 150, 300, 700, 2000]
- min = 90ms
- max = 2000ms
- mean is pulled upward by the tail (300/700/2000)
- p95 is near the high end (it will land around the 19th value depending on method)
- p99 is basically “almost max” in small samples
Key takeaway:
- p95 and p99 tell you about the pain users feel.
- Mean tells you about overall load.
Which metric should you use?
For API latency dashboards
- p50 (median): “typical” request
- p95: “bad but common enough to matter”
- p99: “rare pain; catches spikes and regressions”
- Optionally include mean for capacity context
For user experience / SLOs
- Use percentiles (often p95 or p99) and set targets like:
- “p95 latency under 250ms over 5 minutes”
For debugging / incident response
- max and high percentiles (p99/p99.9)
- Pair with traces/logs to find what caused outliers
For throughput, CPU, memory, queues
- Mean can be fine, but percentiles are still useful:
- Queue depth p95 can reveal bursty backlogs.
Important gotchas
1) Percentiles require enough data
If you only have 50 requests in a window, p99 is mostly noise.
Rule of thumb:
- p90 becomes useful with modest samples
- p95 needs more
- p99 needs a lot (or longer windows, or merging many instances)
2) Don’t average percentiles across hosts
This is a classic monitoring mistake.
Example: If you compute p95 per-instance and then average those p95s, you do not get the true fleet-wide p95.
Correct approach:
- Compute percentiles from the combined distribution (merge raw samples or merge histogram buckets).
3) Weighted vs unweighted averages
If one host handled 10x the traffic, it should count 10x.
Correct approach:
- Use weighted calculations or aggregate at the source (histograms).
4) “Max” often reflects timeouts and retries
A max that equals a known timeout value (e.g., 30s) usually means:
- a dependency was slow
- requests retried
- clients gave up
That’s still important—just interpret it correctly.
Visual examples you can reuse in the post
Use these two simple charts to make the concepts “click” for readers:
1) Min / Max / Mean (Average) on a sample time series
What it shows: a mostly-stable set of request latencies with a few spikes. The horizontal reference lines make it obvious how:
- Min is the best case (fastest request)
- Max is the worst outlier
- Mean/Average gets pulled upward by spikes, even when most requests are clustered lower
Caption idea: “A few outliers can move the mean, even when most requests are fast.”
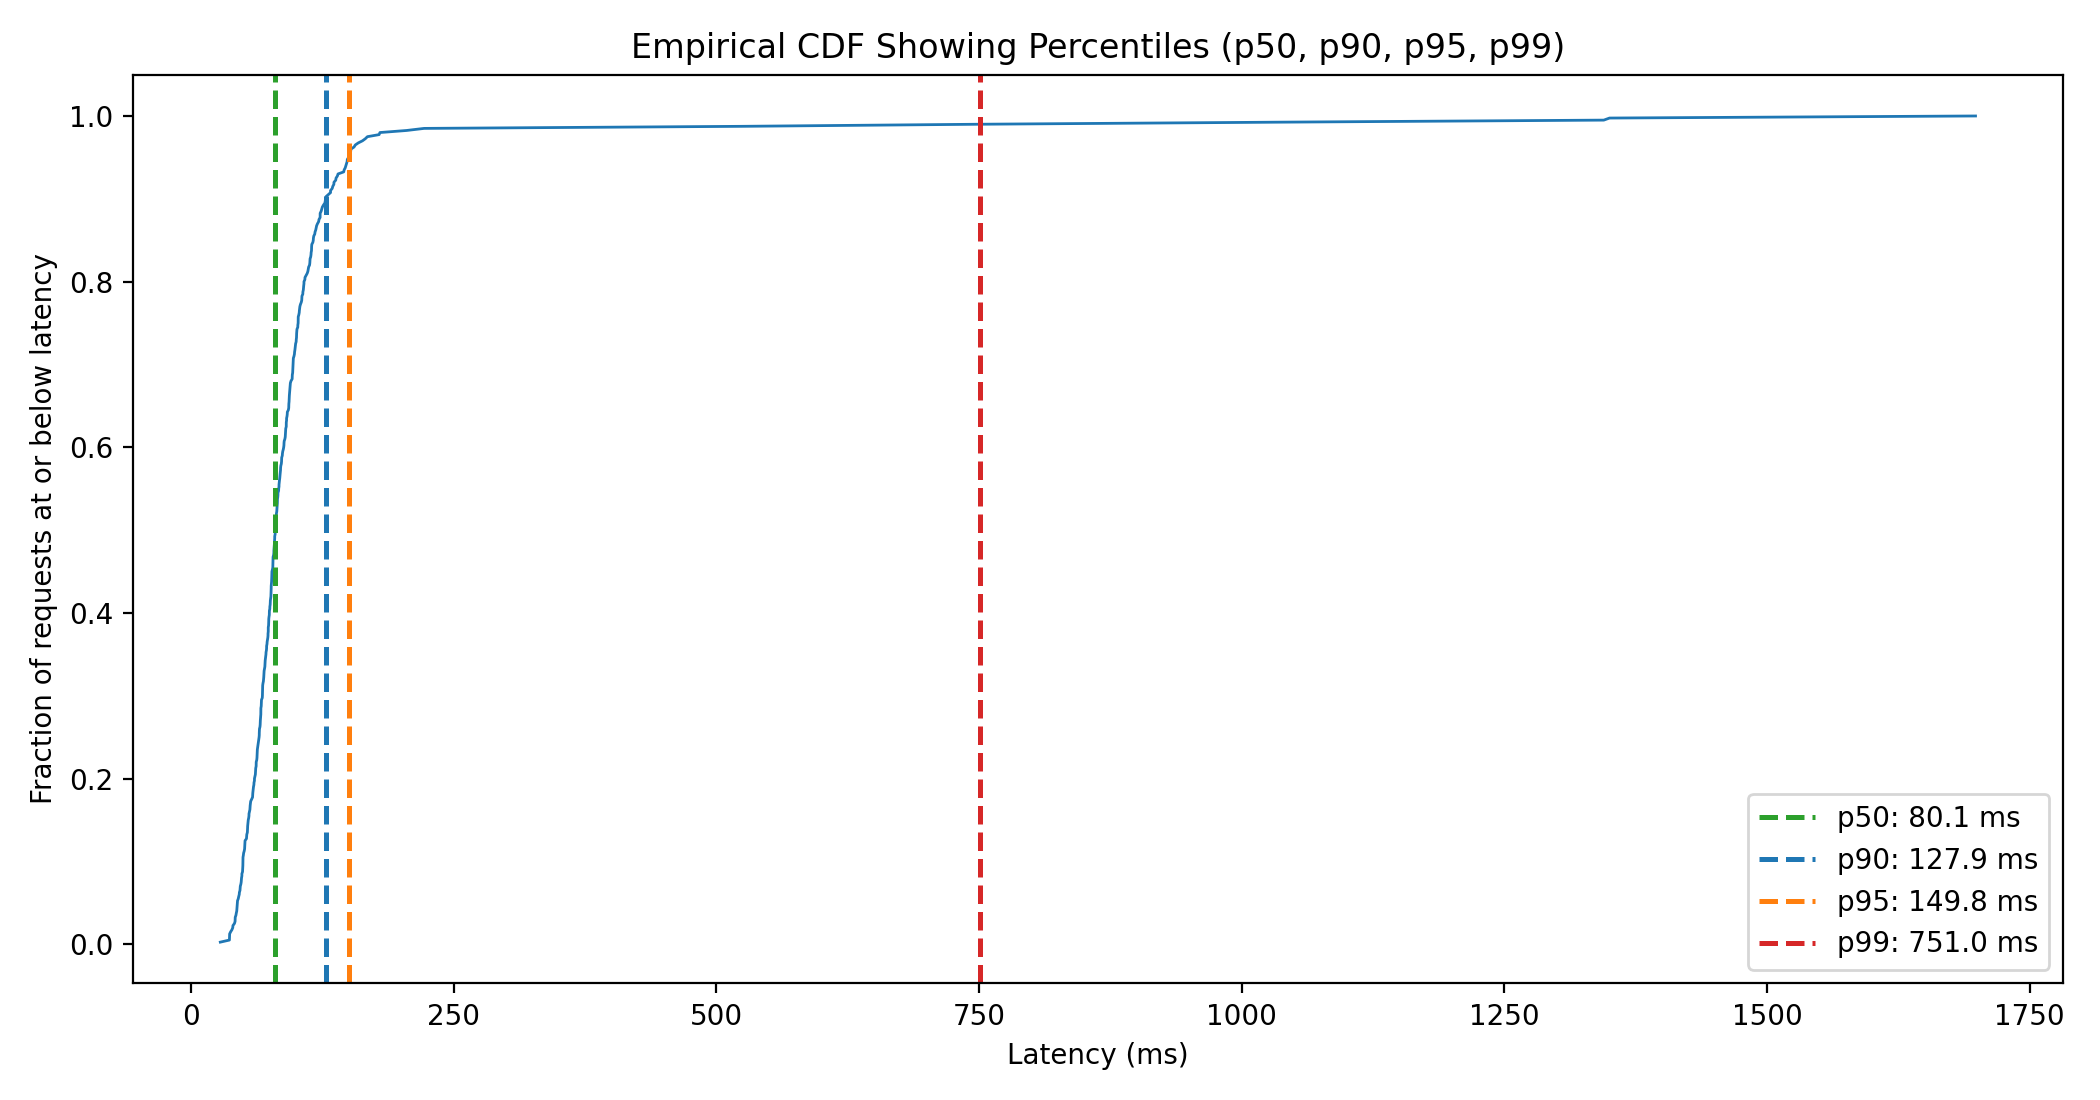
2) Percentiles on an ECDF (p50, p90, p95, p99)
What it shows: an empirical cumulative distribution (ECDF). The curve answers: “what fraction of requests finished at or below this latency?” The vertical lines mark:
- p50 (median): typical request
- p90: slowest 10%
- p95: slowest 5%
- p99: slowest 1%
Caption idea: “Percentiles describe the tail: what the slowest slice of users experiences.”
Tip: If the lines are close together (common for p50/p90/p95), use distinct colors and thicker dashed markers so they’re easier to distinguish.
A practical cheat sheet
- Min: best case; sanity check; not user experience
- Max: worst case; great for debugging; noisy for reporting
- Mean (average): overall load; can hide tail pain
- p90: what most users see; catches mild tail issues
- p95: common SLO choice; strong signal for performance problems
- p99: rare-but-real pain; catches spikes/regressions; needs enough volume
Recommended defaults (monitoring)
If you’re not sure where to start for request latency:
- Track p50, p95, p99
- Alert on p95 for “user-visible slowdowns”
- Watch p99 during incidents and deployments
- Keep mean available for capacity and “overall trend”
Closing thought
If your monitoring only reports the mean, it may tell you “everything is fine” while a chunk of users are having a bad day. Percentiles (especially p95/p99) give you a better picture of real-world experience—and help you catch regressions before your customers do.